Template
Simulation consists of creating geometry and its mesh, defining physical parameters and, after running calculation, post-processing the results into suitable quantities and graphics.
If you are new to simulation and CENOS, we suggest to start with predefined geometry templates, as they will focus more on the structure and basics of the simulation.
Alternatively, you can use your CAD file or create geometry from scratch.
Select geometry building approach
To use geometry templates, in CENOS home window click Template.
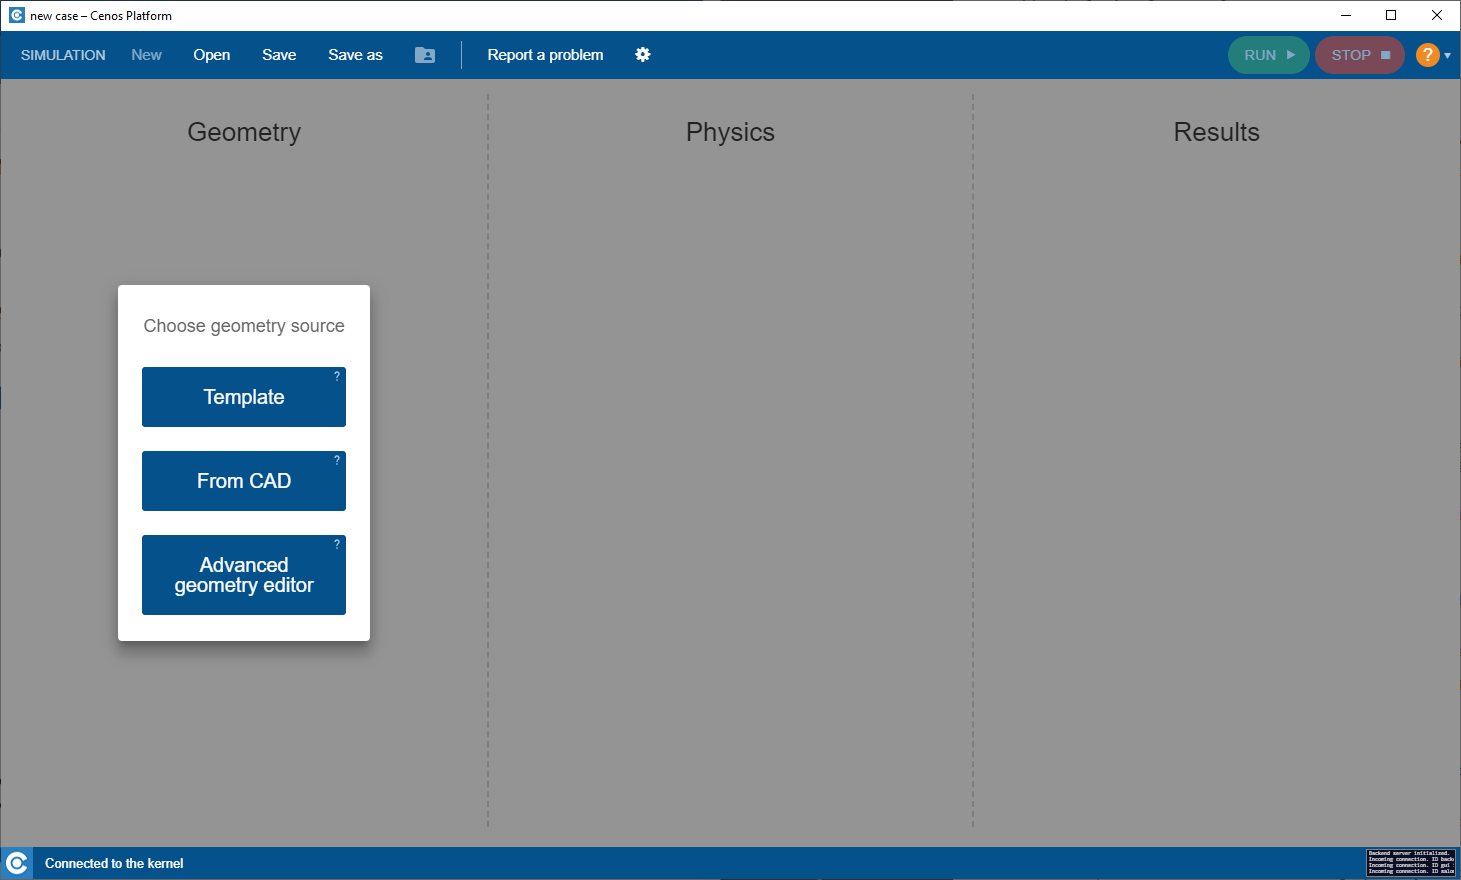
Template automatically defines the non-critical parts of the simulation setup and offers new users a preset simulation physical and geometrical values to get a view on how simulations are defined and to leave you with the important decisions only.
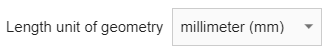
Define units
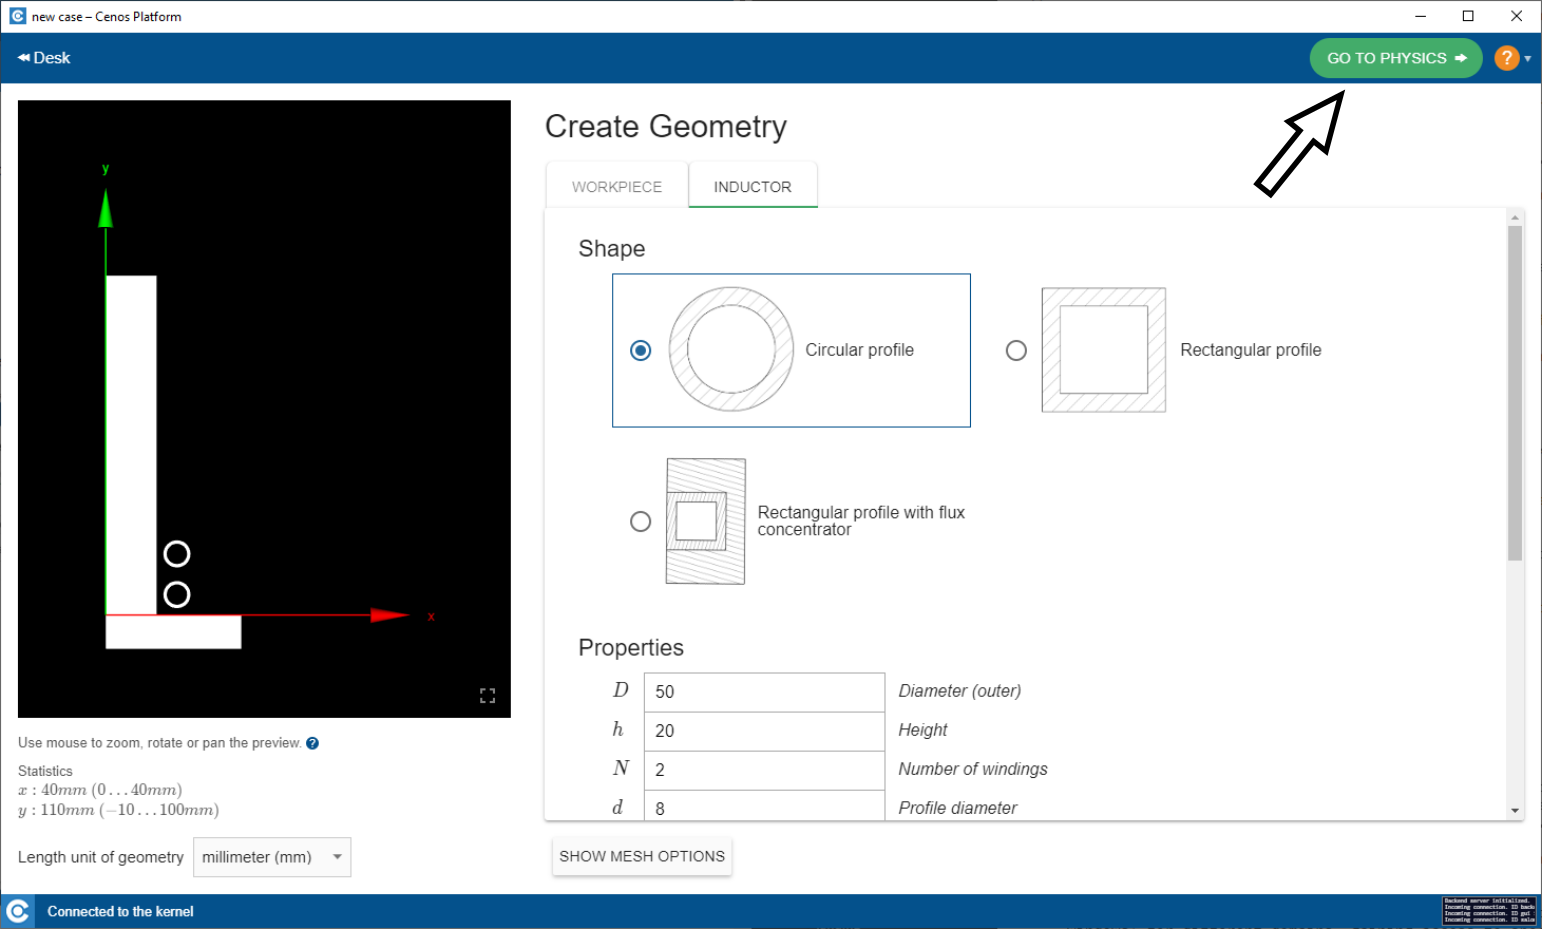
In the Create Geometry window in the left lower corner select units of your geometry.
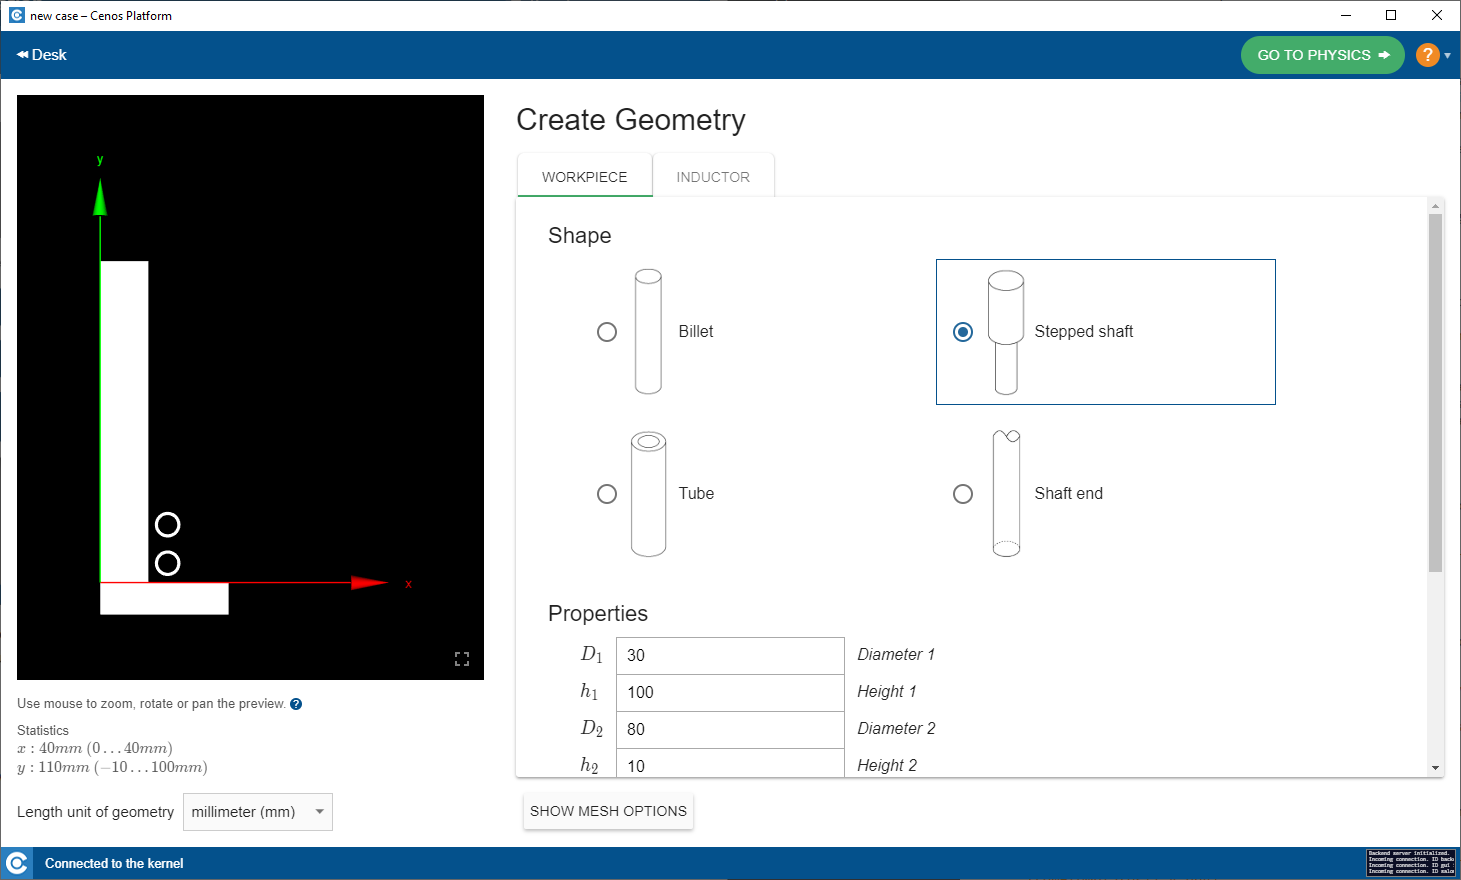
Choose template
Under WORKPIECE and INDUCTOR parts choose the template geometry for simulation domains.
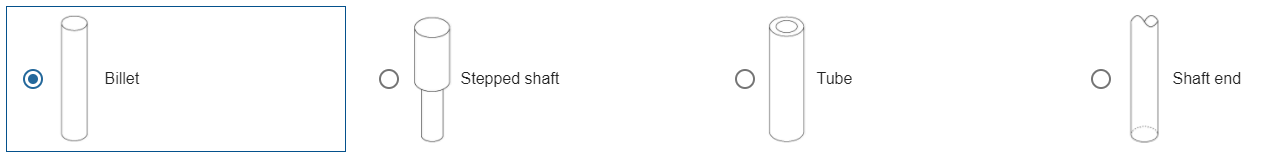

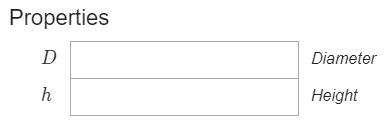
Enter geometrical values
Enter the geometrical values such as diameter, height, thickness etc. to define your geometry.
When done, switch to physics setup by clicking GO TO PHYSICS in the upper right corner of the screen.
Define simulation parameters
Enter physical parameters
In SIMULATION CONTROL window define global parameters such as frequency, calculation time etc.
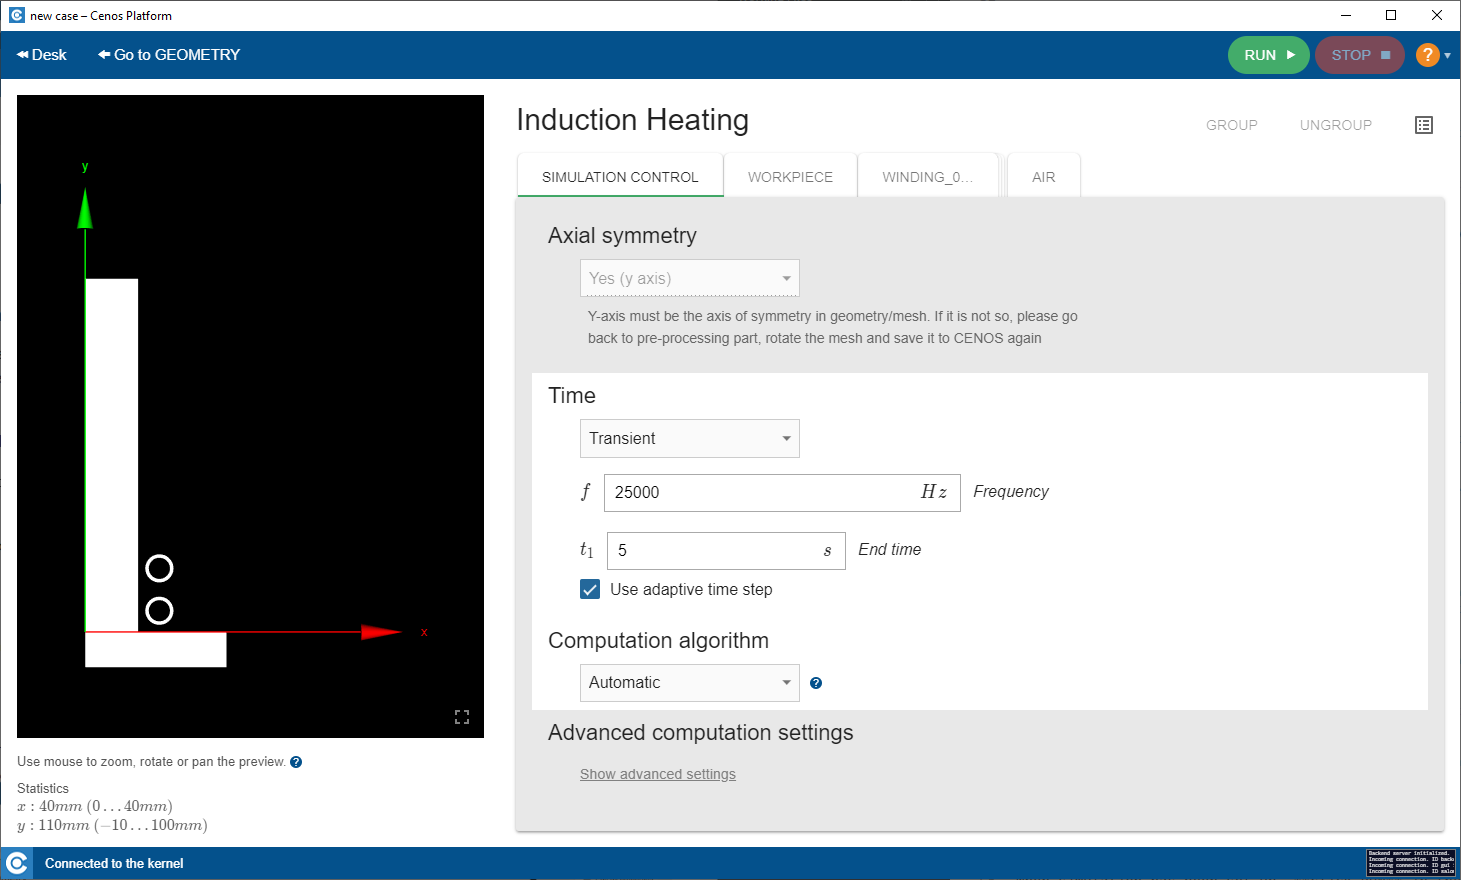
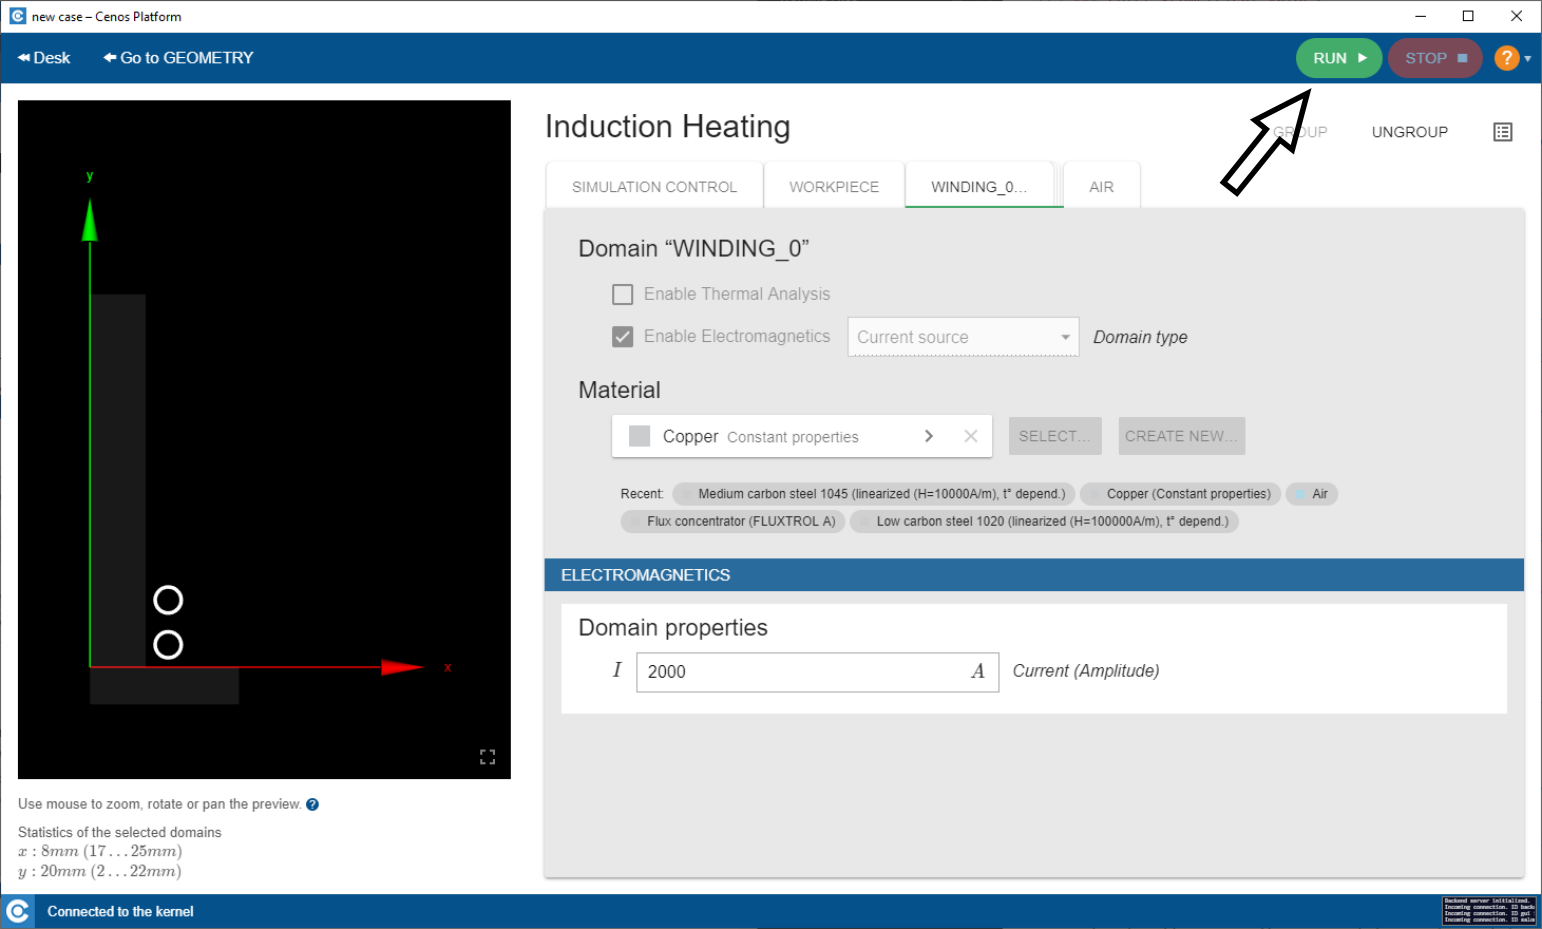
In SIMULATION DOMAIN windows such as WORKPIECE define the physical parameters of each domain such as material, heat exchange, current etc.
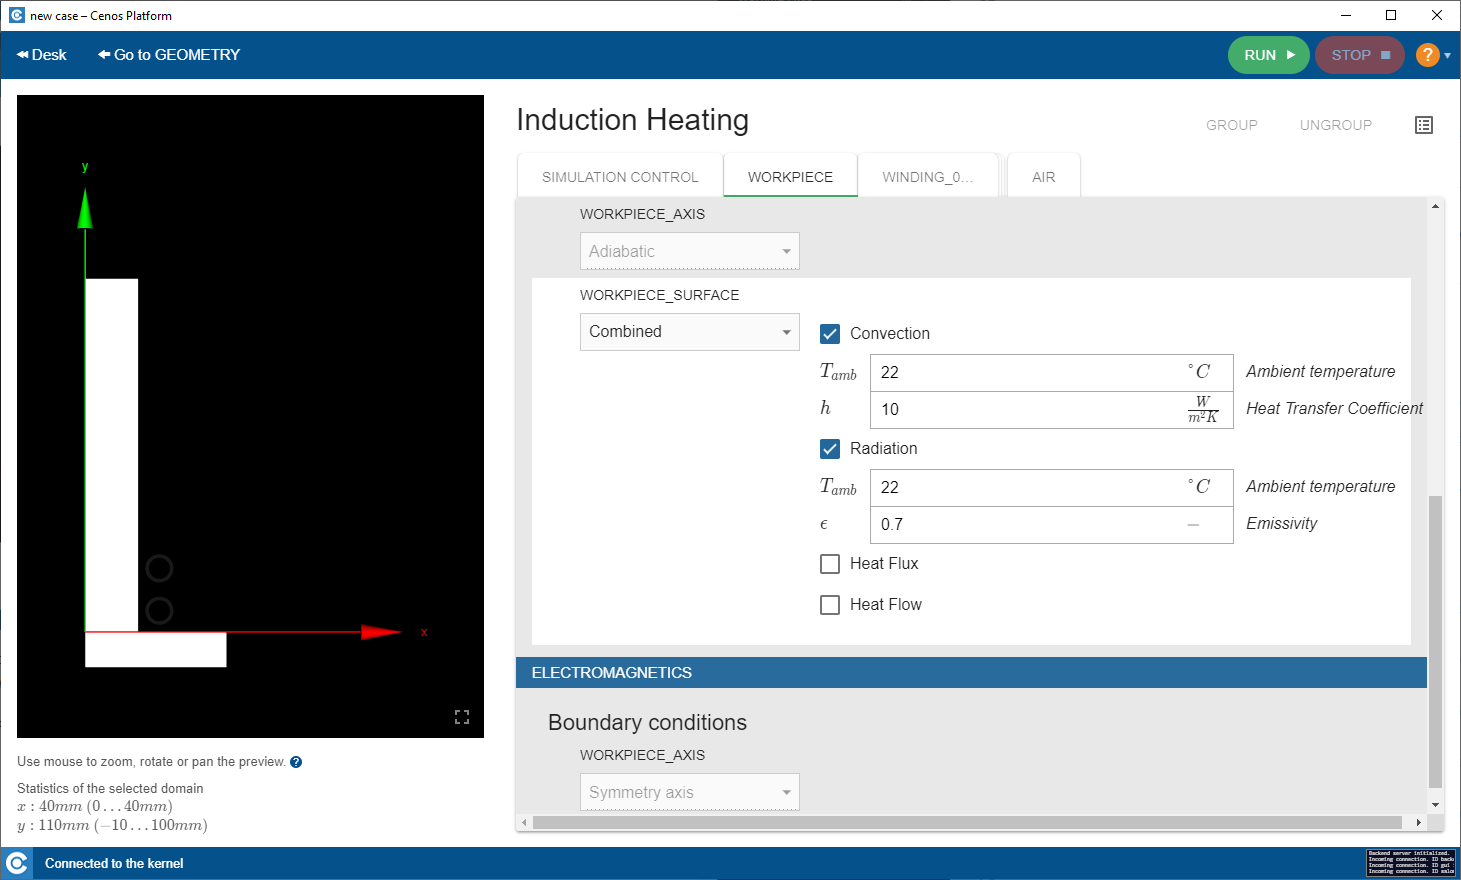
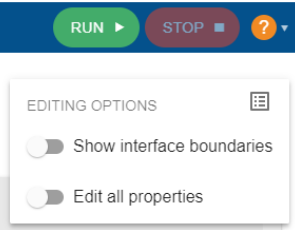
If you feel the need to edit automatically defined parameters, turn on Edit all properties.
Run the simulation
When simulation has been set up, click RUN in the upper right corner of the CENOS screen.
Post-processing
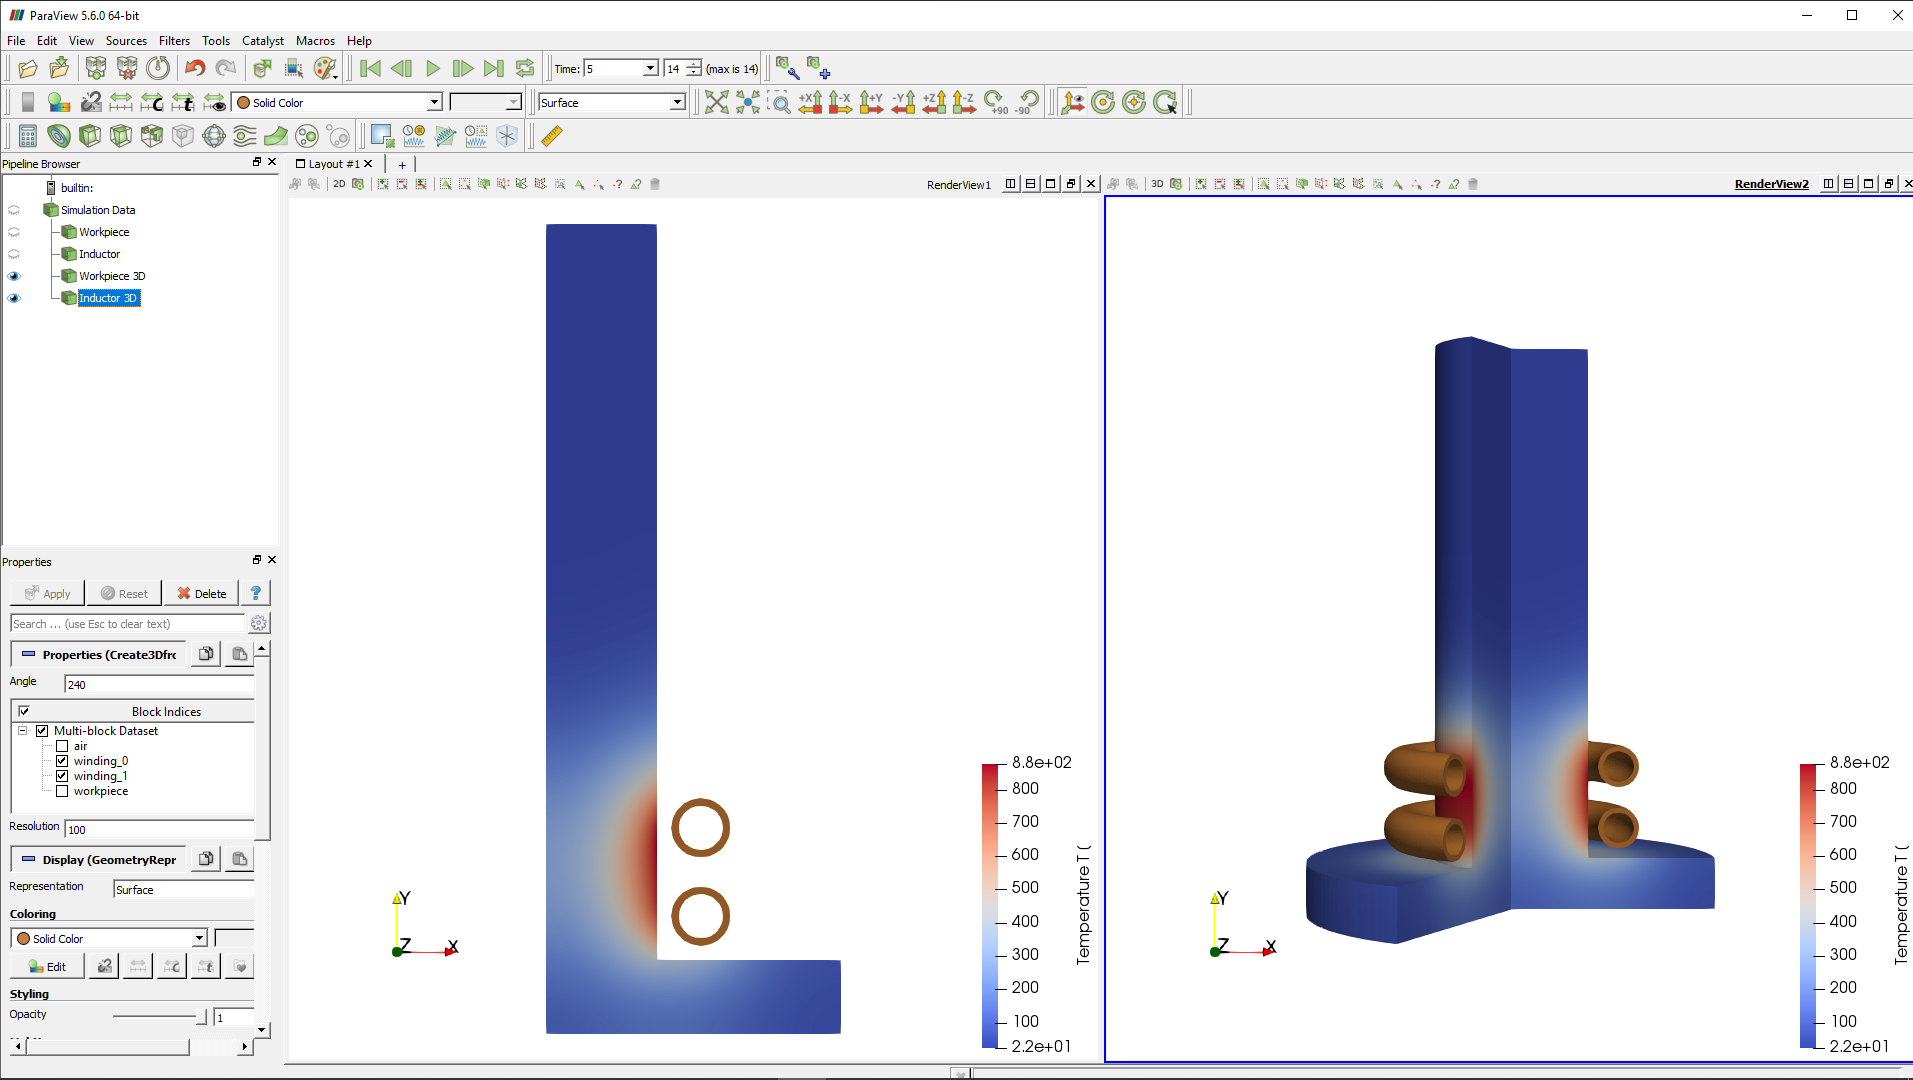
In the end of the calculation the post-processing tool ParaView will automatically open with a pre-set temperature state, and you will be able to see the temperature field distribution in the workpiece in the last time step.
To learn more about result manipulations, visit our post-processing article.
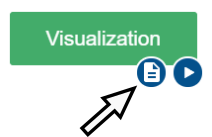
Integral values
For integral values such as apparent power, induced heat and complex voltage you can use the .csv file, which comes along with the visual results. You can access it through Note button next to the Visualization block Play button.